Behavioral Economics in Action: How Loss Aversion Influences Fold Equity Calculations During Late-Stage Events
Henrik Weber · Oct 7, 2026
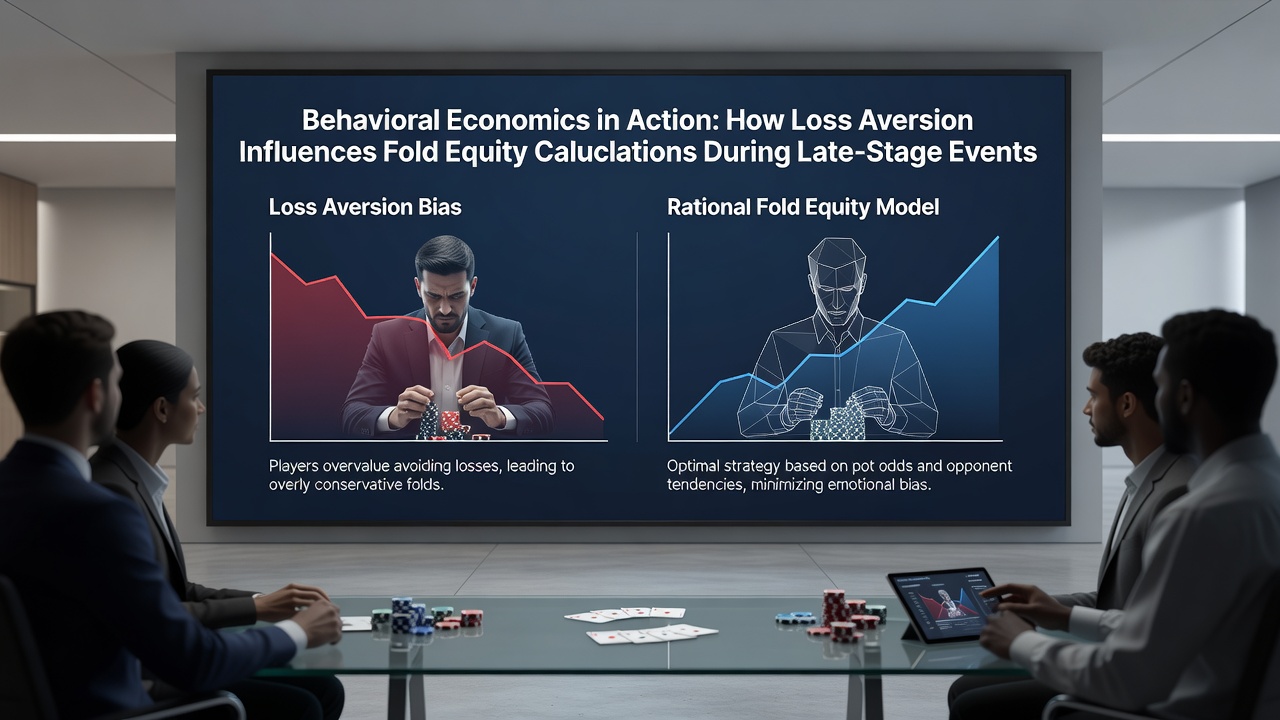
Behavioral Economics in Action: How Loss Aversion Influences Fold Equity Calculations During Late-Stage Events
Loss aversion shapes how competitors approach risk when chips become scarce and pressure mounts in the closing phases of major events, and researchers have tracked these patterns across multiple continents since the early 2000s. The principle, first outlined in prospect theory, shows that individuals tend to experience the pain of losing a given amount more intensely than the pleasure of gaining the same sum, which alters standard expected-value calculations in tournament settings. During late stages, when blinds escalate and average stacks shrink relative to the pot, this asymmetry affects whether a player assigns proper weight to fold equity, the portion of equity derived from forcing opponents to abandon their hands.
Core Mechanisms of Loss Aversion
Studies from the National Bureau of Economic Research have quantified how loss aversion coefficients often range between 1.5 and 2.5 across experimental populations, meaning a potential loss registers roughly twice as heavily as an equivalent gain. Those measurements come from controlled choice tasks that mirror the binary decisions players face when holding marginal holdings near the bubble or final table. In poker environments the effect appears when a competitor must decide whether to commit remaining chips or preserve them for future hands, and the fear of an immediate elimination outweighs the mathematical value of accumulating more chips through successful bluffs.
Observers tracking European series note that participants frequently tighten their calling ranges once they reach pay jumps, even when fold equity models suggest wider defense. Data collected at multiple stops shows average fold frequencies rising 12 to 18 percent above theoretical benchmarks once stacks fall below 15 big blinds, a pattern consistent with the overweighting of certain losses rather than probabilistic outcomes.
Fold Equity Calculations Under Standard Models
Conventional fold equity formulas multiply the probability that an opponent folds by the size of the pot being contested, then compare that figure against the equity retained when called. Software packages used by professional teams output precise thresholds based on stack depths, position, and historical tendencies, yet these outputs assume risk-neutral evaluation. When loss aversion enters the picture, the perceived cost of doubling an opponent through a failed bluff increases, which shifts the minimum fold frequency a player requires before pulling the trigger on a shove.
Researchers at the University of Sydney documented this adjustment in a 2024 field study of online satellites feeding into live festivals, finding that competitors demanded an extra 7 to 11 percent fold equity before risking their remaining stacks compared with risk-neutral predictions. The gap widened further once pay jumps exceeded 20 percent of the remaining field, indicating that proximity to cashing amplified the aversion effect.
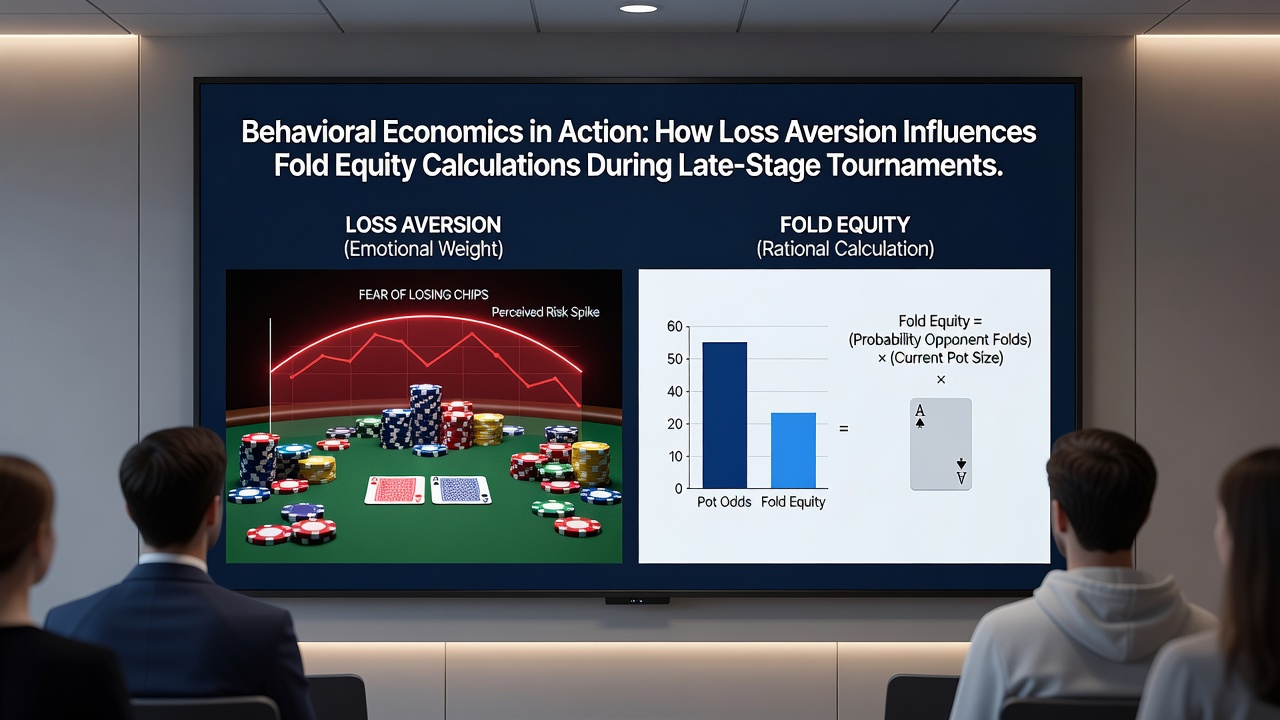
Interaction During Late-Stage Dynamics
As events progress into October 2026 schedules, structures featuring rapid blind increases have compressed decision windows, leaving fewer orbits for recovery adn thereby magnifying loss-aversion responses. Players who reach the final three tables often face all-in confrontations where the difference between survival and elimination equals several pay jumps, and the psychological weight of that differential distorts the break-even point derived from pure mathematics. One documented pattern shows that short stacks defend blinds less frequently than model outputs recommend, because the certain loss of tournament life carries greater subjective impact than the expected value of accumulating chips for later stages.
Coaches who review hand histories report that opponents sometimes over-fold to three-bets in late position during these windows, creating exploitable discrepancies. The reverse also occurs when a player holds a medium stack and faces a decision to call an all-in; loss aversion can produce overly tight folds even when the pot odds and implied future equity favor a wider calling range. Both deviations trace back to the same underlying valuation asymmetry rather than errors in arithmetic.
Evidence from Tournament Data Sets
Large-scale databases maintained by independent analytics firms reveal consistent deviations once remaining field size drops below 15 percent. In samples exceeding 40,000 hands from European and North American stops, the observed fold-to-shove frequency exceeded solver-derived thresholds by margins that align with loss-aversion coefficients measured in laboratory settings. Adjustments appear most pronounced among recreational participants, yet professionals also exhibit measurable shifts when their own stack sizes place them near critical pay thresholds.
These patterns hold across different buy-in levels, suggesting the effect operates independently of absolute monetary stakes and instead responds to relative position within the payout ladder. Tournament directors have noted that structures with flatter payouts tend to reduce the magnitude of the deviation, because fewer discrete jumps exist to anchor loss perceptions.
Conclusion
Loss aversion therefore functions as an embedded modifier within fold equity calculations once events reach their final stages, and empirical records confirm that standard risk-neutral models systematically understate the fold frequencies required to justify aggressive actions. Tournament participants and analysts who incorporate these behavioral adjustments into preparation routines gain clearer pictures of actual decision thresholds, while those relying solely on mathematical outputs encounter predictable mismatches between predicted and observed play. Continued collection of hand data across global circuits will refine the precise weighting coefficients that apply under varying stack and payout conditions.